Home Mail Articles Supplements Subscriptions Radio
The following article appeared in Left Business Observer #131, February 2011. Copyright 2010, Left Business Observer.
Like this? Subscribe today! There’s a lot more where this comes from—and only some of it makes it to the web for free consumption.
Beastly numbers
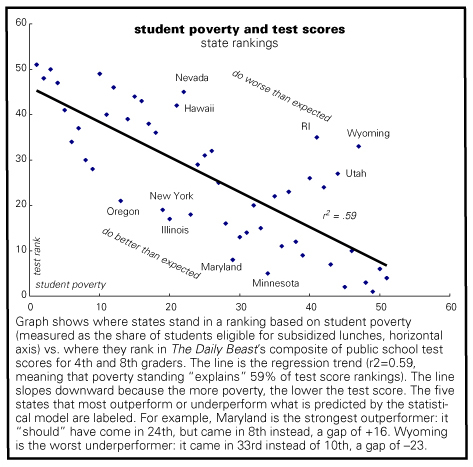
On January 24, The Daily Beast published a ranking of the states based on a composite of reading and math test scores for fourth and eighth graders. The tests were from the National Assessment of Educational Progress, which is probably the best as these things go, though these things are doubtless horribly blinkered ways of viewing the world. The way not to read them was the one taken by The Daily Beast: they called the story “States with the Smartest Kids.” But since tests, as flawed as they are, do predict future economic success or failure with some accuracy, they are still worth looking at. It’s not just that tests are unjust; so is the world we live in.
What happens when you compare the Beast’s rankings with state rankings on things that people think matter in education policy? Most strongly, you find that poverty really matters: almost 60% of the states’ positions in the Beast rankings can be explained statistically by the share of the student population on free or subsidized lunches. (The Beast treats Washington, DC, as a state, and so do we.) A state’s overall income level and poverty rate matter, but not as much as the lunch numbers—which makes sense, since they’re a very good proxy for child poverty.
(Two very important notes before proceeding. The education data comes from the National Center for Education Statistics. And in what follows, ranks on the tests are compared with ranks on the various explanatory factors. Rankings, not levels. Many LBO subscribers had trouble with this. Rankings, not levels.)
There are a bunch of things that don’t matter, or matter much (with mattering defined as a factor’s performance in a regression predicting the Beast ranking). The right’s animus against unions and the alleged cover they provide for incompetents isn’t supported by these numbers. There’s a half-decent correlation (r=.42) between the share of districts with collective bargaining agreement and test outcomes, suggesting that contracts do more to improve performance than hurt it. There’s a tiny negative correlation (–.02) with dismissals for poor performance and test outcomes, one so tiny that you can say that firing has no relation to outcome. But if you throw both these factors into a model along with the lunch indicator, they don’t improve its explanatory power at all.
Teacher tenure—another favorite target of “reformers”—is banned in three states, Mississippi, Texas, and Wisconsin. Their rankings average 33, only because Wisconsin’s 15 brings up the other two (Texas’ subpar 33 and Mississippi’s dead-last 51).
There are thirteen states that prohibit collective bargaining (ten of them in the old Confederacy, by the way). Their average test ranking is 35; only two are in the top half. But more states are going to join that club, because, you know, nothing improves performance like breaking unions and firing people.
New Jersey governor Chris Christie is leading the charge against tenure and unions. He said recently: “The union is awful. The union protects the worst of the teachers. They exist to wring money out of the taxpayers.” It’s hard to figure what he’s bellyaching about: New Jersey comes in third in the Daily Beast rankings (after heavily unionized Massachusetts and less unionized Vermont), and its teacher salaries are not high relative to the state’s average income.
Robust lunch
Collective bargaining aside, teacher salaries are kind of funny. It makes little sense to compare salaries in Maryland (median household income: $69,236) with Mississippi ($37,121, only a little more than half as much): doing that would just be another way of telling you that income matters a lot. But comparing salaries to state averages produces a surprise: poorer states generally pay their teachers more relative to the average than richer ones. So it’s hard to say anything conclusive about the relation between teacher pay and test performance: poorer states pay their teachers a higher relative wage than richer ones (probably because there are fewer jobs requiring a bachelor’s degree or more), but poorer states do worse on tests. No QED here. And if you throw the pay numbers—absolute levels or relative to average incomes—into a model with the lunch numbers, it does nothing to improve its accuracy.
Relatedly, spending looks to contribute less than you might guess. Spending per pupil matches up pretty well with state income, so absolute spending levels (dollars per pupil), especially on instruction (rather than administration) do correlate decently (r=.48) with the Beastly rankings. But when compared to average state incomes, they explain approximately nothing. And again, they add nothing or less to the basic subsidized lunch model. That lunch model is mighty robust.
Curiously, a factor that might be thought to lead straight to poor test performance, doesn’t contribute all that much: the share of students with limited English proficiency. Comparing the rank of states (from low to high) to the Beast rankings yields only a modest correlation coefficient (r=.17), and adding it to the lunch model adds nothing to its explanatory power.
Admittedly, this is a pretty simple take on some complex issues. But the results are still suggestive of important things. Firing teachers in large numbers doesn’t contribute to higher test scores. Teachers’ unions don’t lead to excessively high salaries. And if you could eliminate child poverty, you could eliminate much of our educational problem.
But given what it would take to eliminate child poverty in the U.S.—like a serious upgrading of the public discourse, and some broadly held feeling of social solidarity—we’d live in a very different country. In such a fictional country, it’s easy to imagine that much of the 40% unexplained by child poverty would take care of itself.
Home Mail Articles Stats/current Supplements Subscriptions Radio