Home Mail Articles Supplements Subscriptions Radio
Bush and the price of gas
updated September 14, 2006
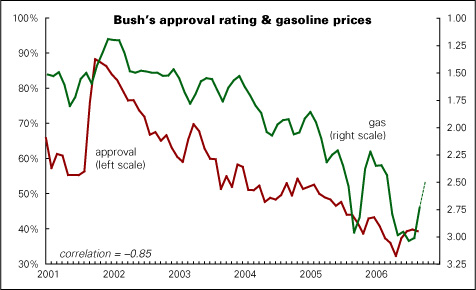
While spikes in energy prices, like that suffered by poor Jimmy Carter, can doom a presidency, no occupant of the White House has ever seen his popularity so closely tied to the price of gas. In fact, more than three-quarters of the variation in W's approval rating since he took office in January 2001 can be explained by movements in the numbers diplayed on pumps nationwide.
Here are two charts that make this point. First is a simple history of the gas price (from the EIA — here's the long-term history and here's the update) plotted with Bush's approval rating, according to Gallup (here's the link, but you have to be a subscriber to get the data). The gas price is inverted, so that higher values are plotted below lower values, so as to match the trajectory of the approval rating. The last part of the gas line, the dashed segment, plots a projected value for October of $2.51, which is where it probably will be based on a NYMEX crude oil price of just under $64, which is where it was on the afternoon of September 14.
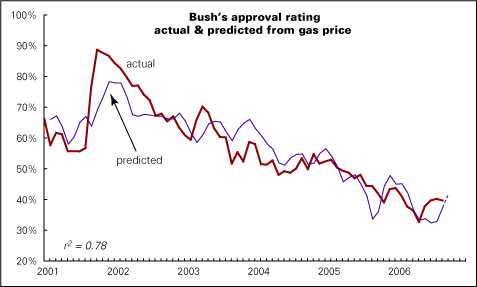
And now here's a chart that shows the actual approval rating along with the approval rating predicted by a simple linear regression on the log of the nominal gasoline price. The results are pretty similar if you use the actual gas price rather than the log, and the real price instead of the nominal price; this is just the best fit. The notation that "r2=.78" means that 78% of the variation in the approval rating can be explained by movements in the price of gas. The last segment of the (purplish) projection line is dashed because it uses the estimated October price of $2.51 to predict October's approval rating of 41%. (Gallup's actual approval rating, as of September 10, was 39%.) Note that Bush's actual approval rating has been running a little over projection in recent months, so it wouldn't be surprising to see his approval numbers rise into the mid-40s in the coming weeks.
There's no precedent for this tight relationship. Approval ratings for Clinton and Reagan were mildly influenced by gas prices, but Bush 41's seems not to have been at all. That may mean that the gas-dependency of W's popularity may actually be a reflection of other things: the war in Iraq has driven up gas prices, as did Hurricane Katrina. So the approval rating, rather than being "caused" by gas itself, may just be reflecting growing public dissatisfaction with the war and the stunning incompetence in handling Katrina. But it's remarkable how closely the approval line follows almost every quiver in the price of gas. So if Bush wants to keep from matching Carter's 28% and Nixon's 25% lows (the worst approval ratings of the past 50 years), he'd better get Cheney to make sure that gas prices keep falling.
© Copyright 2006 Left Business Observer. All rights reserved.
Home Mail Articles Stats/current Supplements Subscriptions Radio