Home Mail Articles Supplements Subscriptions Radio
The following article appeared in Left Business Observer #120, August 2009. Copyright 2009, Left Business Observer.
Like this? Subscribe today! There’s a lot more where this comes from—and only some of it makes it to the web for free consumption.
Overconsuming health
Everyone knows that American consumers have been on a binge for the last ten or twenty years. Data connoisseurs could even tell you that the consumption share of GDP rose from an average of 64% in the 1980s to 70% in 2007–8. But while the numbers are accurate, they’re not really telling the story of a binge. Much of the rise has come from spending on health care, not flat-screen TVs.
Sad to say, LBO was among the many who made the binge argument. We should have known better. Sorry.
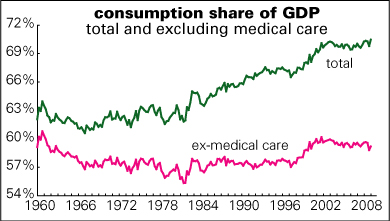
Graphed nearby is a history of the consumption share of GDP, with and without health care spending. (An Econ 101 refresher: GDP is the sum of consumption, investment, government spending, and exports less imports.) Note the relative flatness of the “ex-medical care” line—its recent level is actually below 1960’s—compared with the relentless ascent of the “total” line.
Some numbers to make these points: at the end of 1978, consumption was 61.5% of GDP; in the second quarter of 2008, it had risen to 70.3%, or 8.8 points. Well over half that increase, 5.0 points, came from spending on medical care. The share of GDP devoted to spending on goods actually fell by 4.7 points over that 30-year period.
The pattern is preserved if you start the clock in 1997, just as the stock and housing manias were taking off. Medical spending accounted for almost a third of that rise between 1997 and 2008. Energy accounted for another third. Spending on goods accounted for just 3% of the rise, or 0.1 point. In other words, the familiar story that Americans went hogwild buying all kinds of stuff is wrong.
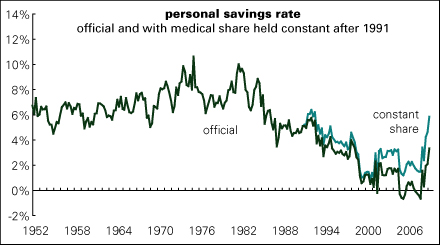
So the much-lamented decline in the U.S. savings rate begins to look less lamentable in light of this news. (Technical point: the decline in the savings rate is a function not only of people putting less money in the bank—it’s also a reflection of higher borrowing.) Graphed below is the personal savings rate as reported along with how it would look had the medical bite out of after-tax income remained constant at 1991’s rate over the last 18 years. The bottom line: it would have declined much less dramatically into its 2005–6 lows, and would since have risen back to 1992 levels.
Little of this vast medical spending is done directly by individuals. To understand how this all works requires a brief detour into national income accounting.
Only about 40% of household spending on health care comes from paying the doctor directly out-of-pocket; most of the rest comes from paying insurance premiums (including Medicare). But it’s not just the premiums that individuals pay directly; the national income accountants also attribute the employer share of health insurance premiums to households. The logic of this is that fringe benefits are a substitute for wages and salaries, which take the form of medical care (or pension contributions). That may seem a little strange—it’s not income you can spend on rent or a prosciutto, arugula, and brie sandwich, but it is a form of compensation.
While the morality tale of American overconsumption isn’t supported by a close look at the data, that doesn’t mean that the rise in reported consumption and the collapse in reported savings (at least until very recently) is meaningless.
The few Wall Street analysts who’ve taken note of the medical contribution to the consumption spike have perversely been arguing that since there was almost no consumption bubble when you exclude medical care, the retrenchment in spending could be less severe and protracted than many expect. But that’s certainly not the story that the recent retail sales figures are telling: they collapsed in late 2008 and early 2009, and have continued to erode since. With labor income very weak and credit very tight, and with neither likely to stage a vigorous recovery anytime soon, the decision to retrench might not be freely made.
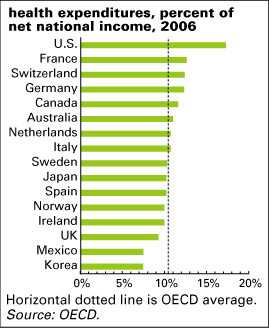
But there’s also another point here. While the consumption spike may look like the result of an accounting convention, it’s also reflecting a sad reality: an enormous, and ever-increasing share of our national income is going to health care. Of course, some unquantifiable share of that spending makes people healthier, happier, and more productive. But much of it doesn’t. In economic jargon, it’s a deadweight loss. As the graph above shows, the U.S. devotes a far larger share of its national income to health care than any other country: 37% more than the second-biggest spender, France; 49% more than Canada; 68% more than Sweden; 87% more than the UK. Yet U.S. health indicators are consistently among the worst in the OECD, with terrible ratings on life expectancy, infant mortality, obesity, and mental health. U.S. readings on all these are worse than countries spending far less on health care.
So the rise in the consumption share of GDP and the long slide in our savings rate is telling us something. American consumers aren’t the profligates of legend, but that our health care system certainly is.
Home Mail Articles Stats/current Supplements Subscriptions Radio