Home Mail Articles Supplements Subscriptions Radio
The following article appeared in Left Business Observer #111, August 2005. It retains its copyright and may not be reprinted or redistributed in any form - print, electronic, facsimile, anything - without the permission of LBO.
Frothing at the house
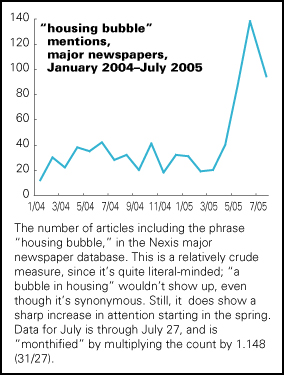
Suddenly the housing bubble is everywhere. The chart nearby is proof—though July saw a cooling from May and June's ecstasy of discovery.
This puts the financial psychologist in a tough situation. Clever traders like to think of the mob as wrong (and of themselves as never part of the mob). So it's tempting to conclude that there can't possibly be a housing bubble because so many people think there is one. But then there's the model of the Recession Index, an idea that LBO stole from The Economist—a count of articles in major newspapers including the word "recession." It's often an accurate and timely measure of when one is beginning and ending. The housing bubble began a while ago, but that so many people are now recognizing it suggests that the affliction may be entering its terminal phase. Talking obsessively about the bubble might be a way of warding off talking about its unpleasant aftermath.
The bubble, and the easy money that's financed it, has been crucial to the economic recovery since 2001. By one measure (that of Asha Bangalore of Northern Trust), housing has contributed over 40% of the cycle's employment growth. Building and remodeling are contributing a near-record share of GDP. Real estate has accounted for 70% of the increase in household wealth over the same period.
Oddly, the official culture celebrates when housing gets more expensive; it's supposed to be the sign of a healthy economy, even though it makes it harder to afford one of life's essentials. But as Ed Hart, the late credit market pundit on the late FNN, used to say, "housing inflation is the American national religion." And we're in a very religious phase now.
What follows is all about the U.S. As The Economist's global house price indexes remind us, it's been a global boom in shelter. The U.S., up a mere 73% since 1997, is a piker next to Spain (+145%), Ireland (+192%), and South Africa (+244%). About the only exceptions are Germany (–0.2%) and Japan (–28%—its housing market still hasn't recovered from the bust of the 1980s!). What follows applies, with appropriate national adjustments, to just about every non-sclerotic region of the world.
Dreamers
Until recently, the dominant public voice on the bull market in housing has been one of reassurance. A headline in a recent Money magazine promised nothing more jarring than the always-comforting "soft landing." Alan Greenspan, who spent much of the late 1990s denying the existence of a stock bubble, has spent much of the last couple of years denying that housing was getting pumped up. He coyly argued in a May 6 speech, "nominal house prices in the aggregate have rarely fallen and certainly not by very much," which sounds reassuring.
A bit over a month later, Greenspan amended his thinking by saying that "although a 'bubble' in home prices for the nation as a whole does not appear likely, there do appear to be, at a minimum, signs of froth in some local markets…." Froth, as any beer-drinker knows, is a large collection of tiny bubbles, so this is a concession of sorts. As was his acknowledgment that speculation has had a hand in pushing house prices higher. But Greenspan quickly reassured: there is no national housing market, just a "heterogeneous" collection of loosely connected local markets, whose movements aren't tightly correlated with each other. We've been through this sort of thing in the past, he reminded us, but without having to confront "significant declines in the national average level of home prices. In part, this is explained by an underlying uptrend in home prices." The uptrend can be explained by the uptrend.
Taking measure
Large chunks of Greenspan's analysis don't survive fact-checking.
He's right that sustained declines in nominal house prices have been rare since the great collapse of the 1930s, when prices fell by 25–30% (though "real" declines were much smaller, since prices fell by roughly that much from 1929 to 1932). But real declines have not been rare since the end of World War II.
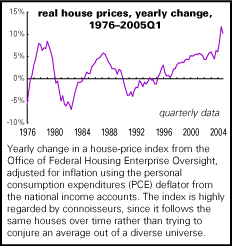
There are several measures of house prices to work with, but they all tell the same story: years of rampant increase. Let's look first at the index preferred by connoisseurs, from the Office of Federal Housing Enterprise Oversight (OFHEO), the agency that sort of oversees the mortgage repackagers Fannie Mae and Freddie Mac. We've adjusted it for inflation (using Alan Greenspan's favorite price index). Results are graphed nearby. Sadly, the index only begins in 1975, but we can still see two instances of sustained price declines. Note that the left half of the chart is characterized by two full up- and down-cycles, and the right half by one long and virtually uninterrupted uptrend.
It's not just house prices that have been levitating—so too have new building and trading in existing houses. Shown below is a graph of the share of residential investment in GDP and the value of sales of existing houses as a percent of GDP. New investment levels are among the highest in the last 50 years. Higher peaks were scaled in the late 1940s and early 1950s, but those were bouncebacks from nearly two decades of depression and war. We haven't seen a sustained downtrend in the share since the late 1980s.
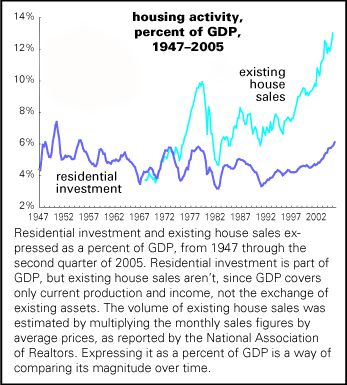
Trade in existing houses is even hotter. Sales topped out at just under 10% of GDP in 1979, late in an inflation-driven real-estate mania. They surpassed that in 2002, and are now over 13%.
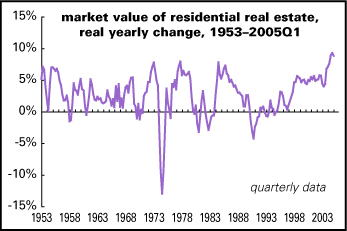
Another measure of generalized levity is the total market value of household real estate. Shown below is a chart of the yearly real change in the Federal Reserve's estimates of the value of the housing stock, from its flow of funds accounts. Housing's real value has undergone many up-and-down cycles, including a savage decline in the mid-1970s. Note that the third quarter of 2004 set a record since the figures began in 1952. Less immediately visible on the chart is the fact that the first quarter of this year marked the 40th consecutive quarter of gains, which easily surpasses the previous streak of 34 consecutive quarters, set in 1969.
Value
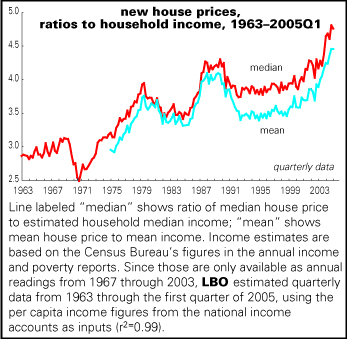
So maybe that growth is justified by broader economic growth. But comparing house prices to household incomes shows that shelter is getting much more expensive, as the nearby chart shows.
An international comparison by Goldman Sachs shows that while average U.S. house prices are not outlandish by historical standards, there's plenty of outlandishness in hot markets. House prices in San Francisco, the most expensive U.S. market, are almost 18 times per capita GDP; the only precedent for such a level was Tokyo at the end of the 1980s. New York is a mere 10 times, where Tokyo is now, and behind London's 14. Variations within U.S. markets appear to be much wider than in other countries—which makes sense, because they're more densely populated and our income distribution is more polarized. These are the valuations against which millions of homeowners have borrowed huge gobs of money, much of which they've spent on lawn furniture and flat-screen TVs.
It's not only housing valuations that are nutty, it's the financial adventurism they've inspired. According to estimates from Goldman Sachs, U.S. households performed $1.9 trillion in "mortgage-equity withdrawal" (MEW) between 2001 and 2004—the sum of home equity loans, fresh cash taken out during mortgage refinancings, and cash pocketed on selling a house. That's 136% of the growth in income over the same period. During the boom years, 1993–2000, MEW was just 45% as large as income growth. In other words, MEW has been one of the major contributors to the American propensity to live beyond our means.
Thoughtstyles
Mortgages themselves are getting nuttier, too. Lately we've seen strong growth in the "negative amortization" mortgage, meaning that the initial payments don't even cover the interest bill; the unpaid balance gets tacked onto principal. In a year or three, the introductory teaser will expire, and full freight will have to be paid. A third of new mortgages—half in hot areas—have been at adjustable rates so far this year, even though interest rates are very low and more likely to be adjusted up than down. By contrast, in 2000, when rates were over 2 percentage points higher, just 20% of new mortgages were adjustable. The last two times the adjustable share was over 30% were in 1994 and 1999, when rates were about to take long slides. Subprime mortgages—loans to poor people and bad credit risks—are 28% of the total, compared with 5% in 2000, the peak of the last bubble. One in six homeowners have a mortgage equal to 95% of the value of the house, six times as many as a decade ago.
Should interest rates rise and/or house prices fall, then a lot of people are going to find themselves in a pickle.
Why are bankers making such risky loans? One reason is that they're a little desperate; profitability is down sharply in the industry, and there's tremendous overcapacity. Another reason is that banks themselves rarely hold onto the loans; they're packaged into bonds and sold in large chunks to institutional investors. And the investors may assume that Alan Greenspan will save them should things go sour. Why not? He's done it many times in the past.
When risk can be passed along like that, there's an incentive to overlook it. It used to be said of Soviet-style economies that they were systems of "generalized irresponsibility." We've got the capitalist version of that going in the USA.
Already peaking?
You have to wonder if the housing market has already put in what stock market analysts call a momentum peak. Such a peak happens when prices keep rising, but at a slowing rate as the ultimate top approaches.
Opposing that possibility is the fact that bubbles always seem to outlast expectations. And nothing untoward is likely to happen until interest rates rise seriously.
As with all speculative markets, prices could rise further and for longer than seems rationally possible. But, whether it takes two months or two years, the housing market will run out of steam, and a great stimulus to U.S. economic growth will be lost. MEW—financed ultimately with the cash coming from the Asian central banks who keep buying U.S. Treasury bonds—has goosed up consumption. Merrill Lynch estimates that a mere flattening in house prices would knock 1 percentage point off economic growth. That would bring us down to what economists call a "growth recession"—not a contraction, but growth slow enough to feel like rather bad times. The cooling of the Australian housing boom has knocked over a point of GDP growth, and it looks like something similar is unfolding in Britain.
But knocking a point of GDP growth is a dull conclusion to this piece. We've had a ripping boom with little historical precedent, and it would be strange if it ended in a mere whimper. It's kept consumption far above its long-term trend, with hardly an interruption during the 2001 recession. Much of the capital imported into the U.S. over the last five years has gone into financing the mortgages that powered the boom.
You might think that after a boom without precedent you'd get a bust without precedent. We got something like that with the stock market, but it never ran its full course: a mild recession with almost no anti-business political backlash is a strange sequel to a severe bear market. Housing just took up the baton after the stock market collapsed from exhaustion.
A serious decline in housing prices and a rise in interest rates could throw a lot of households into the tank. But it must be admitted that the U.S. economy has shown an enormous capacity to take a lickin' and keep on tickin'.
Home Mail Articles Stats/current Supplements Subscriptions Radio